-

- Investors
- Key performance indicators
Key performance indicators (KPIs)
KPIs demonstrate the Group’s resilient performance in 2025 compared to 2024. The Board and the Management use KPIs when assessing and measuring performance of the Group against set strategic priorities.
| Group | Statutory | Underlying | |||
|---|---|---|---|---|---|
| 2025 | 2024 | 2025 | 2024 | 2024 | |
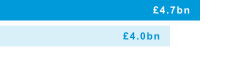
Gross new lending*
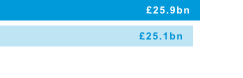
Net Loan Book
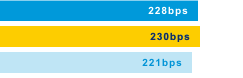
Net interest margin*1
Cost to income ratio*

Profit before tax

Loan loss ratio

Common Equity Tier 1 (CET1) ratio

Return on equity*

Ordinary dividend*

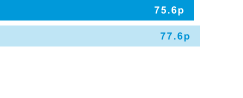
Basic EPS* (pence per share)
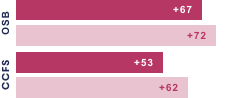
Savings customer satisfaction – Net Promoter Score (NPS)
Women in senior management2
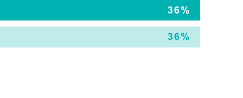
57%
Reduction in direct emissions3
- 2025 statutory NIM is comparable with 2024 underlying NIM as both metrics exclude acquisition-related items, which were fully written off in 2024.
- Employees at grades A (Executive Director) to grade E (including function heads with senior direct reports or employees in specialist roles of a senior nature).
- Direct emissions are Scope 1 and Scope 2 using market-based methodology.
* The Group’s external auditor performed an independent reasonable assurance review of certain KPIs as marked with the symbol * – for the auditor’s assurance report, see the Appendix in the 2025 Annual Report and Accounts.